 Skip to content


Many traditional demand gen metrics were built around simple funnels: capture a form fill, route to SDR, count outcomes.
But that’s not how many B2B purchases behave now. Today’s buyers self-educate, loop in stakeholders late, and stall often. Gartner found that 61% of B2B buyers prefer a rep-free buying experience and 73% actively avoid suppliers who send irrelevant outreach.
Meanwhile, Forrester reports that 86% of B2B purchases stall during the buying process.
When purchases stall, attribution windows stretch. Or when decisions happen in groups, single-lead scoring lies. And when buyers avoid irrelevant outreach, volume metrics punish you for being precise.
This post is a practical framework for demand generation metrics that hold up in exec conversations and still help marketers optimize. No fluff. No “track everything.” Just the metrics that show ICP fit, engagement depth, and real intent over time.
The most common metric traps
These traps usually show up when teams are under pressure to “prove impact” quickly.
- Over-indexing on raw lead volume: encourages broad targeting, which often lowers relevance and downstream engagement.
- Counting MQLs without an ICP-fit audit: makes conversion rates look like a sales problem.
- Using channel CTR as a success proxy: clicks are cheap—real attention and follow-through aren’t.
- Reporting “influence” without rules: if everything influences, nothing informs.
The fix is to build demand generation metrics that sit between “activity” and “revenue” and are tightly tied to buyer behavior.
A better measurement model: fit, engagement, intent, progression
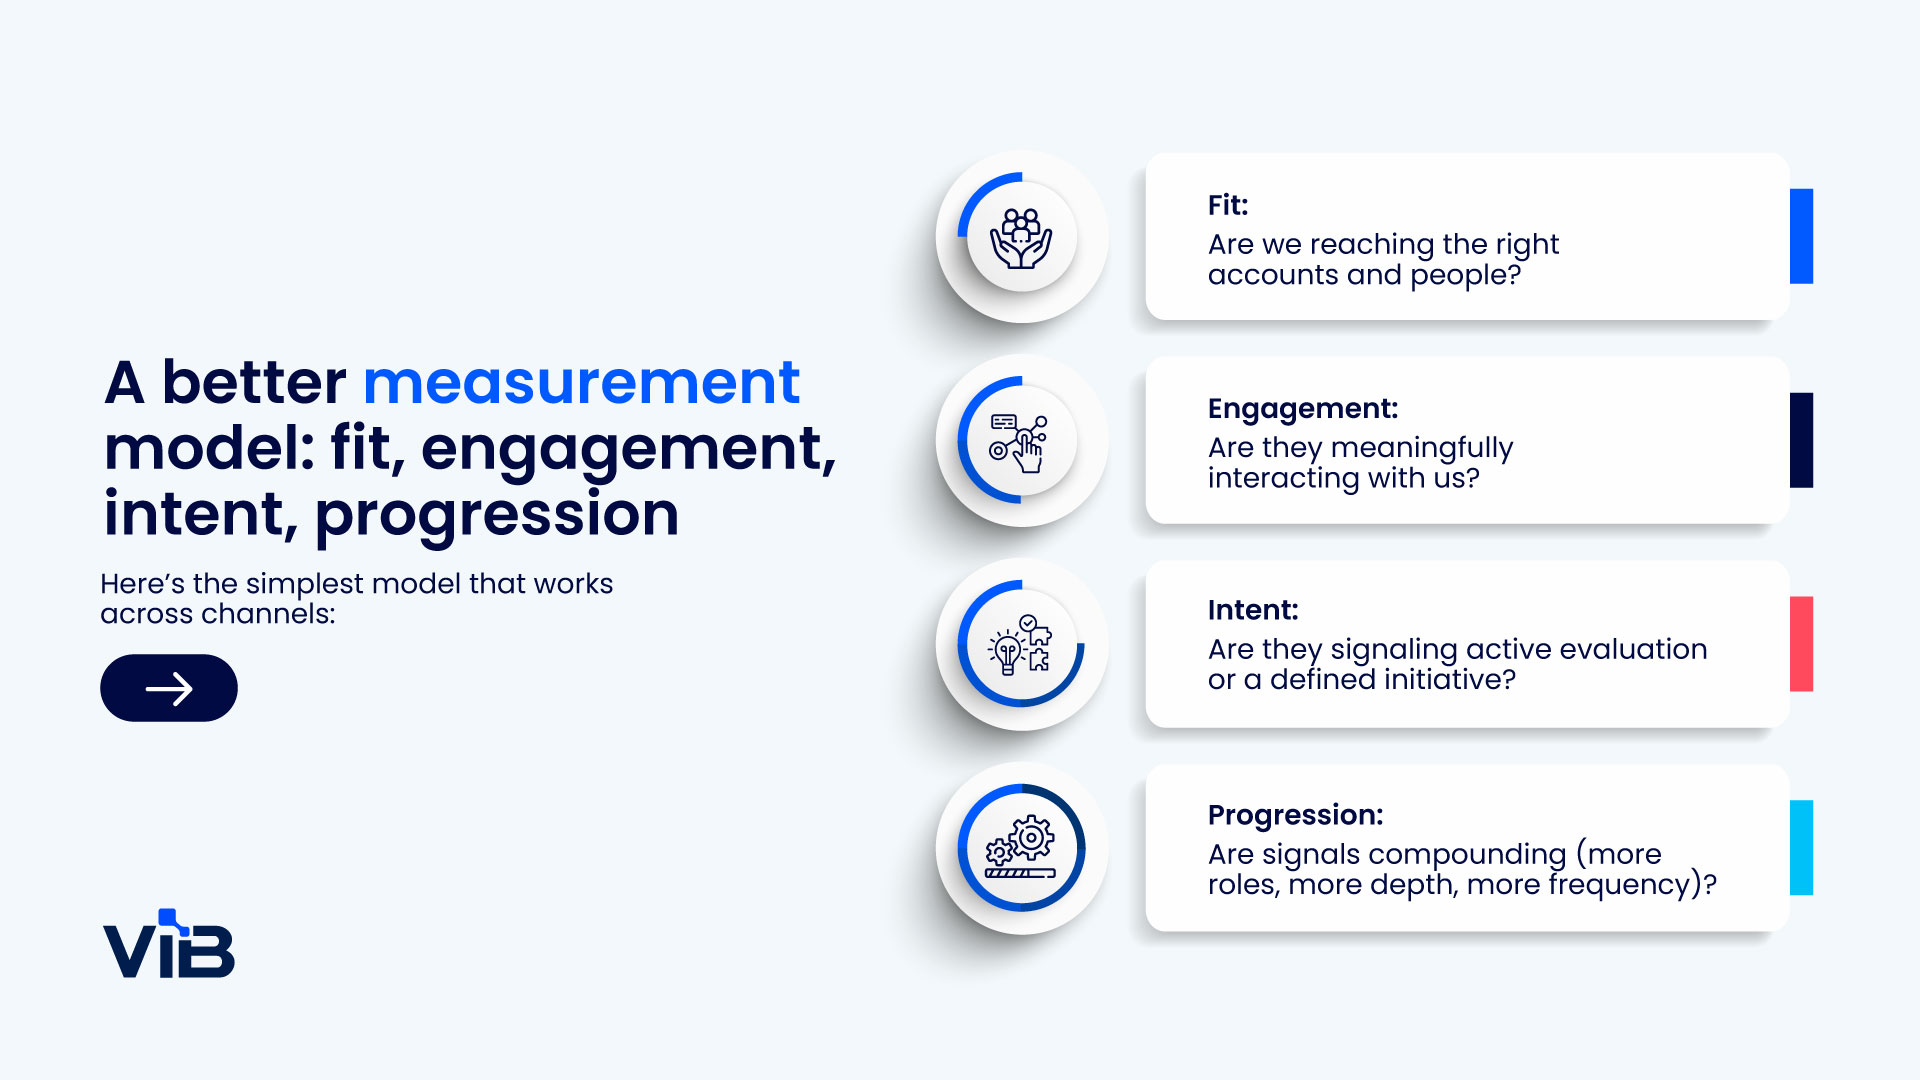
Here’s the simplest model that works across channels:
- Fit: Are we reaching the right accounts and people?
- Engagement: Are they meaningfully interacting with us?
- Intent: Are they signaling active evaluation or a defined initiative?
- Progression: Are signals compounding (more roles, more depth, more frequency)?
When you build demand generation metrics around those four factors, reporting becomes clearer and optimization gets faster.
Demand generation metrics for ICP fit
Fit metrics aren’t exciting, but they’re the difference between scalable demand gen and constant “lead quality” debates.
Track these fit metrics consistently:
- ICP match rate by channel and offer: Percentage of engaged contacts that meet firmographic, technographic, and role criteria.
- Role coverage within accounts: Are you reaching only one function, or multiple stakeholders?
- Account concentration: Percentage of engagement coming from your top target segments (by industry, size, region, tech stack).
- Net-new account engagement rate: Percentage of engaged accounts that have not previously interacted with your brand (define “previously” clearly).
Demand generation metrics for engagement depth
Engagement is where most teams either overcomplicate (too many micro-metrics) or oversimplify (just CTR). You want a few metrics that reflect time, depth, and return behavior.
Also, don’t confuse “channel engagement” with “buying engagement.” They overlap, but they’re not the same.
Core engagement metrics to standardize across programs
- Engaged account rate: accounts with 2+ meaningful interactions in a defined period (e.g., 30 days).
- Engagement minutes per account: aggregate time across key assets (product pages, comparison pages, webinars, demos, pricing, integration docs).
- Repeat engagement rate: Percentage of accounts that return within a certain time frame.
- Depth events: webinar attendance (not just registration), multi-asset consumption, “high-intent page” views, tool usage, or assessment completion.
You can still track CTR and conversion rate, but treat them like diagnostics, not success definitions.
Make engagement comparable with a simple scoring rubric
If you can’t compare webinar attendees to content downloads to high-intent page visits, your reporting will stay fragmented.
Create a lightweight rubric with 4–6 weighted actions. Keep it boring. Keep it stable. Then run experiments inside it.
- Tier 1 (light): email click, single blog read, social engagement
- Tier 2 (moderate): asset download, webinar registration, return site visit
- Tier 3 (strong): webinar attendance, multiple stakeholders engaged, product/integration page depth
- Tier 4 (highest): explicit evaluation signals (see next section)
Reminder: Buyers prefer to self-serve, but they’re also quick to disengage from irrelevant experiences. That makes “engagement quality” your most defensible demand generation metric.
Demand generation metrics for intent
This is where senior teams separate themselves. Intent isn’t one thing. It’s a spectrum, and your metrics should reflect that.
Think of intent in three layers: behavioral intent, comparative intent, and explicit intent. 🔎
Behavioral intent metrics (good, but easy to misread)
- High-intent pageviews per account: pricing, security, integration, migration, “vs competitor,” ROI pages.
- Return frequency: number of sessions over a set time frame.
- Asset sequencing: patterns like “guide to comparison to case study to integration.”
These are useful, but they can still be research-only behavior. Use them to trigger better experiences, not aggressive outreach.
Comparative intent metrics (shortlist signals)
Comparative intent is the “we’re narrowing options” zone. It often shows up as:
- Competitor + category co-consumption: viewing comparison content plus category-defining assets.
- Stakeholder expansion: more roles engaging within the same account over a short window.
- Event Q&A quality: questions about integration paths, security posture, deployment model, procurement constraints.
Explicit intent metrics (the cleanest signal when you can get it)
Explicit intent means the buyer tells you what they’re doing and why. That could be through surveys, research panels, event applications, or other opt-in motions.
Your best explicit-intent demand generation metrics usually include:
- Declared project window: “evaluating in 0–3 months / 3–6 / 6–12.”
- Declared requirements: must-haves, current environment, constraints.
- Declared stakeholder map: who’s involved and what they care about.
- Declared budget range or approval process: even directional detail improves relevance.
When you can measure explicit intent, it changes how you prioritize accounts and how you judge performance. It also reduces “guesswork reporting,” which everyone secretly hates.
Demand generation metrics for progression
Progression metrics are the most underused, and they’re often the most persuasive in exec updates. They answer: “Is momentum building in the right places?”
Progression metrics to add to your dashboard
- Account engagement velocity: time from first touch to first high-depth action (e.g., webinar attendance or multiple asset consumption).
- Signal stacking rate: percentage of accounts that hit 2+ intent signals within 30 days.
- Buying group growth rate: increase in unique engaged titles per account over time.
- Relevance acceptance: for opt-in programs, the percentage of targets who choose to engage when presented with the offer (this is your “message-market fit” metric).
If you’re seeing fit and engagement but no progression, it’s usually one of three issues: the offer is too early, the message is too generic, or the channel doesn’t align with the audience’s preferred research path.
How to operationalize demand generation metrics without breaking your team
You can design the perfect framework and still fail if it’s hard to run. Here’s the operational approach that tends to stick.
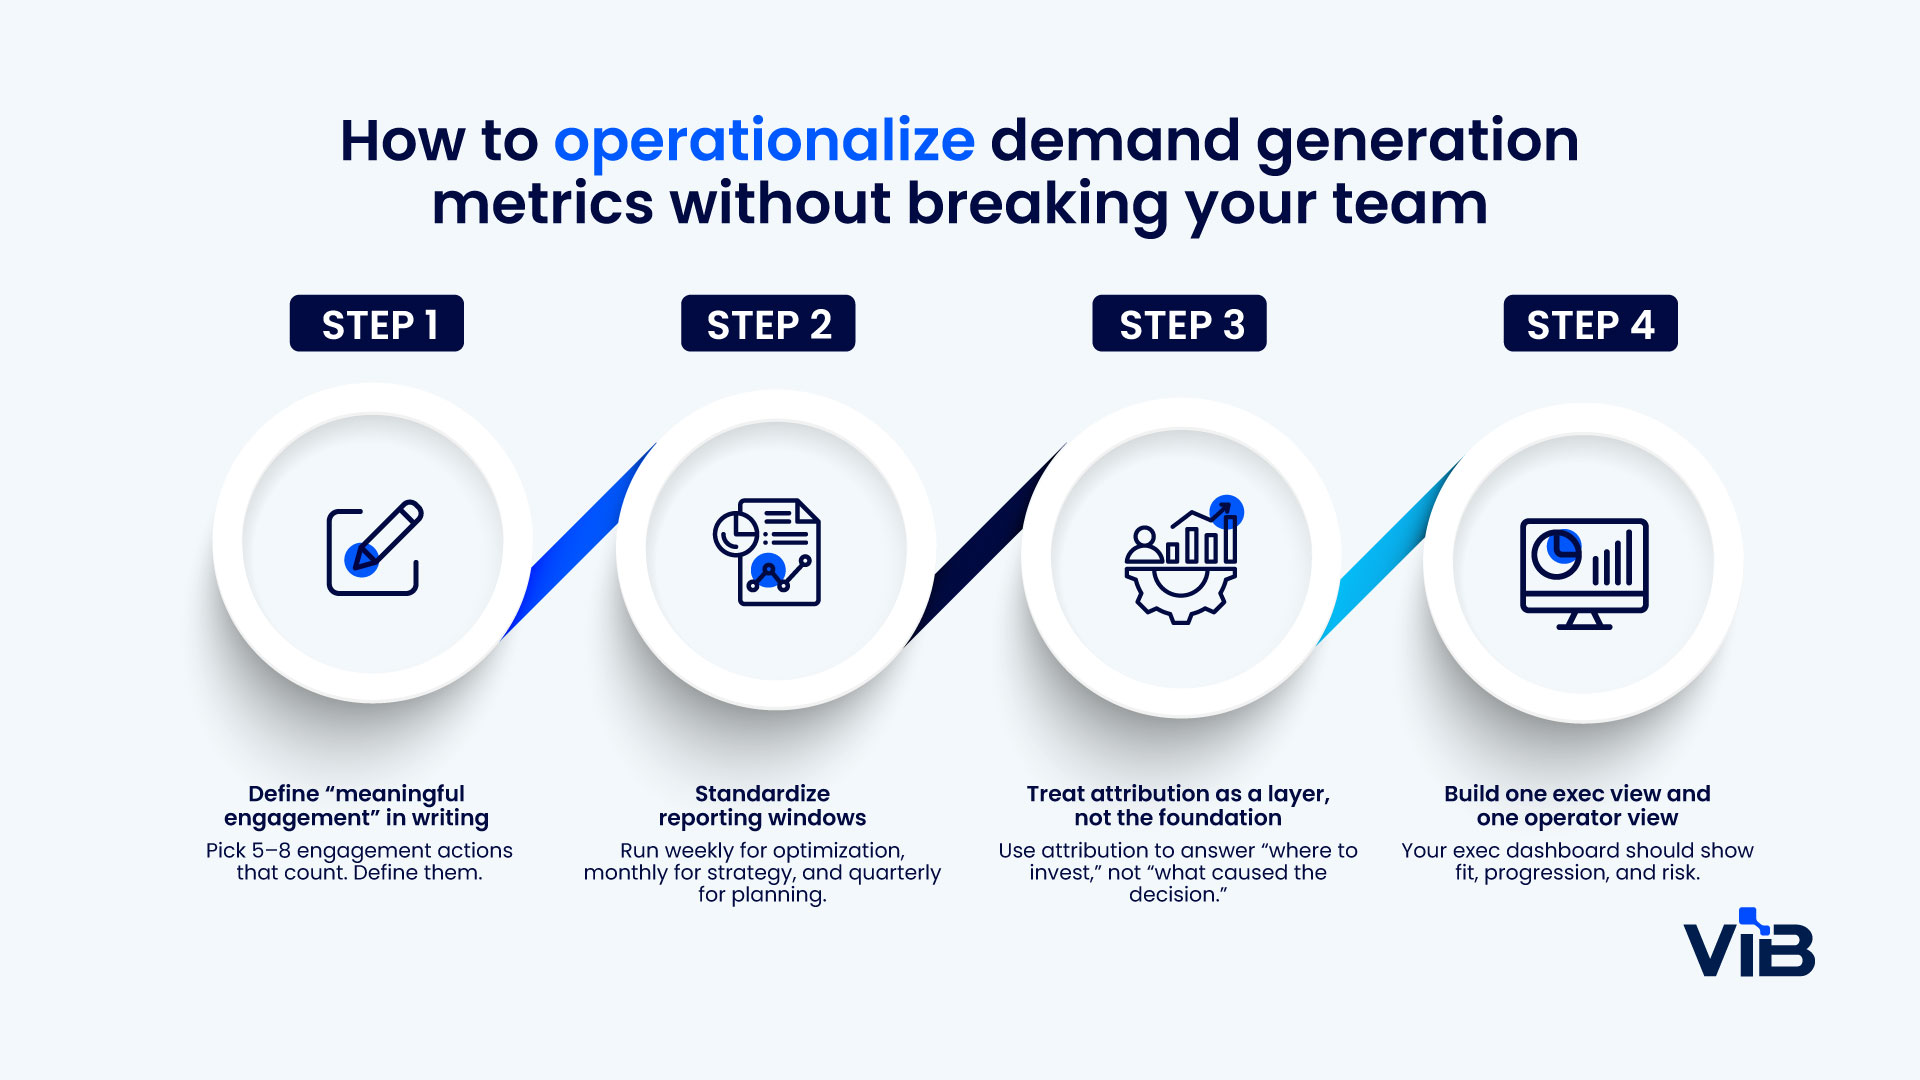
Step 1: Define “meaningful engagement” in writing
Pick 5–8 engagement actions that count. Define them. Don’t renegotiate them weekly.
Step 2: Standardize reporting windows
Run weekly for optimization, monthly for strategy, and quarterly for planning. Mixing these windows is where narratives fall apart.
Step 3: Treat attribution as a layer, not the foundation
Use attribution to answer “where to invest,” not “what caused the decision.” In complex B2B, that’s often unknowable, and pretending otherwise creates bad incentives.
Step 4: Build one exec view and one operator view
Your exec dashboard should show fit, progression, and risk. Your operator dashboard should display performance, audience segments, creative, and drop-off points.
And yes, it’s okay to keep it simple. Your dashboard doesn’t need to be impressive. It needs to be used. ✅
Where ViB fits when you want stronger engagement and cleaner signals
If your measurement strategy is built around fit, engagement depth, and intent, you’ll eventually hit a constraint: you can’t improve demand generation metrics if you can’t consistently generate measurable, high-quality interactions.
This is where solutions like ViB can help.
ViB Syndication: Improve fit and engagement metrics
When you need top-of-funnel reach that still respects ICP constraints, content syndication can work, but only if quality controls are strong and reporting is consistent.
ViB Syndication generates content downloads from an opted-in community, using ICP targeting to measure engaged-account lift and downstream content consumption more cleanly.
ViB Webinars: Create measurable depth events
Webinars are among the easiest ways to generate “depth events” that align with real evaluation. The problem is consistency. Even great topics can flop without distribution.
ViB Webinars is a full-service webinar solution with a guaranteed audience, helping teams standardize webinar attendance as a reliable engagement-depth metric quarter over quarter.
ViB Emails: Generate measurable response signals
If you’re trying to improve demand generation measurement, targeted email provides a repeatable way to test audience relevance, topics, and messaging.
ViB Emails shares your message with an opted-in technology community and generates measurable campaign engagement data. That helps teams evaluate which audience segments and messages are producing meaningful responses.
ViB Emails and ViB Appointments: Support progression tracking
When you’re trying to increase signal stacking and buying-group coverage, you need consistent, targeted touches and a reliable way to create two-way interactions.
ViB Emails can generate demand by sharing your message with our opted-in community. And with ViB Appointments, prospects can apply to meet you directly. Used carefully, that “opt-in interaction” becomes a strong progression metric and a sound quality check on messaging.
Conclusion: The best demand generation metrics reduce debate and increase learning
Good demand generation metrics don’t just justify spend. They make your next decision easier.
If you build your reporting around fit, engagement, intent, and progression, you’ll spend less time arguing about lead quality and more time improving relevance, content performance, and buyer experience.
And in a world where buyers actively avoid irrelevant outreach and purchases stall more than we’d like, that’s the job: create measurable engagement and credible signals that show you’re reaching the right people at the right time.


